Lancement : Menu [Analyse] > [Test/Caractérisation de CCD] > [Efficacité de transfert (CTE) Fe55]
Cette fonction n'est pas accessible depuis la version light. Afin de pouvoir l'utiliser, il est nécessaire d'obtenir une clé "version complète" pour le logiciel.
But : Tester l'efficacité du transfert de charge d'un CCD d'un pixel à un autre.
This is a very powerful experiment used to derive
the vertical and horizontal CCD charge transfer efficiency (CTE)
and also can provide a extremely accurate measurement of the
conversion factor. An Iron (Fe55) radioactive source is installed
100 mm from the CCD, in the vacuum. This source produces X-rays
(5.9Kev photons) that reaches the CCD surface, creating inside the
CCD bulk 1620e- in a 0.5/1um sphere. If those 1620e- are produced
within a single pixel, they should be detected at the output of the
CCD readout node as 1620e- times the conversion factor. Because of
"failures" during the charge transfer, some electrons are lost and
remains in the next pixel, and this is not . This can happen either
during the vertical transfer or the horizontal transfer (serial
register). Since the amount of electrons produced by the Fe55 are
well defined, it is possible to compute the horizontal and vertical
CTE.
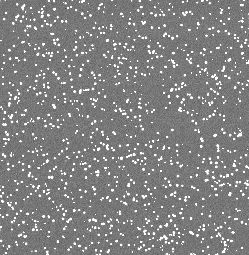
A 30 sec exposure image, CCD in front of a Fe55 source :
Histogram plot of the whole CCD, pixels from the bias level and the two peeks of Fe55 (Ka1620e- Kb1778e-) are visible :
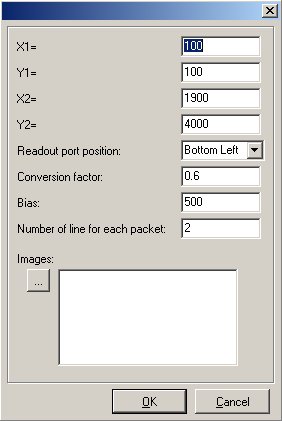
In the dialog form, enter the window to be processed (X1,Y1,X2,Y2). Then the readout direction (CCD output port direction left/right). The conversion factor must be known within 5% accuracy. The bias offset level as also to be provided (accurate, from overscan areas or master bias frame). Select more than one image is recommended for better accuracy, as so as to enter more than 2 lines for each packet. Those packet are used to bin the histogram of a line/column N times.
Results :
Console output:
Load image: iron-1.cpa
Load image: iron-3.cpa
Load image: iron-2.cpa
Load image: iron-4.cpa
CTEV=1.000000101
CTEH=0.999997222
Conversion factor=0.680809
Horizontal CTE histogram as an image the fact that the slope is left tilted showed that CTE is lower than 1.0 :
Vertical CTE histogram as a printable plot (very good V.CTE) :
Horizontal CTE histogram as a printable plot (H.CTE =0.999997222 ) :
Method used :
The software performs vertical histogram gathering N columns so as
to have a better Signal to Noise measurement, it also uses more
than one image to improve the measurement Then displays an image
where the X axis is the counts in ADUs, Y the column number and Z
the number of pixels having the given X counts. The softwarefinds
the histogram peaks for every column and fits the best slope. As
you can see on the image above, the slope that joins all the peak
is slightly tilted to the left, showing that the 1620e- created at
the end of the serial register (column 2048) are indeed less than
1620e-, thus showing a CTE not equal to 1. The software, according
to the histogram peak slope can compute the HCTE.
The same method applies for the horizontal CTE, just swap the word
vertical with horizontal and the word column with rows.
Focntion script associée :
![]() GetCTE
GetCTE
Images de test :
![]() Images de test
Images de test
Conditions d'activation du menu :
![]() Aucune
Aucune